The Stephen Bunnell Lab
T Cell Receptor Signaling in Live Cells
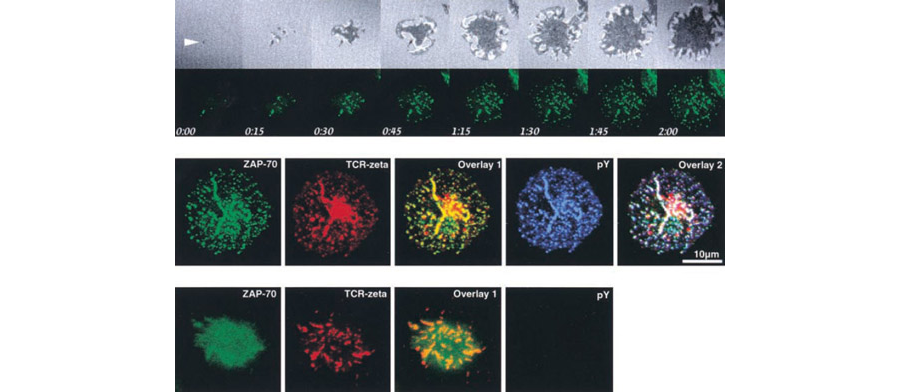
Tissue function depends on the ability of cells to translate cues from the cellular microenvironment into biologically significant actions. This requires cells to discriminate between signals of differing strengths and qualities. During T cell activation, the inability to respond correctly to external stimuli can result in either uncontrolled infections or autoimmune disorders. My lab has a long-standing interest in understanding the mechanisms which govern the response of T cells. This interest extends to understanding the role of cellular compartmentalization and signal transduction. For this purpose, I have developed a system that allows visualization of events in live cells and used this approach to study the molecular consequences of T cell receptor (TCR)-induced signals. T cells that express fluorescently-tagged chimeric proteins are placed on planar substrates, thereby permitting direct assessment of complex events in real time. We have already used this approach to examine TCR-induced cytoskeletal rearrangements and to image the movements of five critical signaling intermediates in live Jurkat T cells: ZAP-70, a TCR-associated tyrosine kinase, and the signaling adapters, LAT, Grb2, Gads, and SLp-76. The picture below illustrates our approach.
Figure 1. These images illustrate our technique. In the top row, Jurkat T cells expressing ZAP-70–EGFP were plated on coverslips. ZAP-70–EGFP and interference reflection microscopy images were collected every 15 s using the Zeiss LSM 410. The white arrow marks the earliest observed signaling cluster and contact point. In the center panel, Jurkat T cells expressing ZAP-70–EGFP were plated on stimulatory coverslips, fixed after 5 min, and stained for both TCR and phosphotyrosine. ZAP-70–EGFP, TCRζ, and phosphotyrosine were pseudocolored green, red, and blue, respectively. The TCR staining pattern shows a large cluster in the center of the contact; this strong signal results from the staining of a large, perinuclear pool of TCRζ. In the lower panel, cells were processed and imaged as in B after pretreatment and stimulation in the presence of 10 µM PP2, an inhibitor of Lck and Fyn.
My lab is using this and other techniques to approach four questions. First we would like to know which proteins participate in TCR-induced signals. We plan to dynamically image proteins such as Lyn, Fyn, PAG/Cbp, Shc, Shb, Cbl, PI3K, PLCγ, ADAP, Itk and Vav as well as other scaffolding proteins. FRET will also be used to determine the proximity of various molecules when greater precision is needed. We are particularly interested in SLP-76 and its potential role in signaling.
Figure 2. The cartoon depicts possible interactions involving SLP-76 following TCR signaling. A proposed role of the SH2 domain of SLP-76 is indicated by the open box.
A second and related question centers on how complexes are perturbed when one of the components is missing. Cells deficient in selected proteins because they are from knock-out mice or were treated with RNAi will be used to approach this issue. We are also interested in determining if critical signals originate in internalized vesicles. Lastly, we are particularly interested in determining how the signals and complex translocations we document are related to immune function in vivo. These investigations should provide unique insights into the interplay between signal transduction and cellular compartmentalization during T cell activation.


