The Jose Ordovas Lab
Gene-Environment Interactions of Circadian-Related Genes Impacts Cardiometabolic Traits
Our previous work has shown that common circadian-related gene variants associate with increased risk for metabolic alterations including type 2 diabetes. However, little is known about whether diet and sleep could modify associations between circadian-related variants and cardiometabolic traits. Therefore, we are investigating associations and interactions between dietary intake/sleep duration and selected variants on cardiometabolic traits. Our recent work includes a meta-analysis of 15 cohort studies including up to 28,190 participants of European descent from the Cohorts for Heart and Aging Research in Genomic Epidemiology (CHARGE) Consortium. Our results suggest that lower carbohydrate intake and normal sleep duration may ameliorate cardiometabolic abnormalities conferred by common circadian-related genetic variants. Further examination of these interactions could lead to the development of specific dietary recommendations for individuals based on their personal genetic makeup.
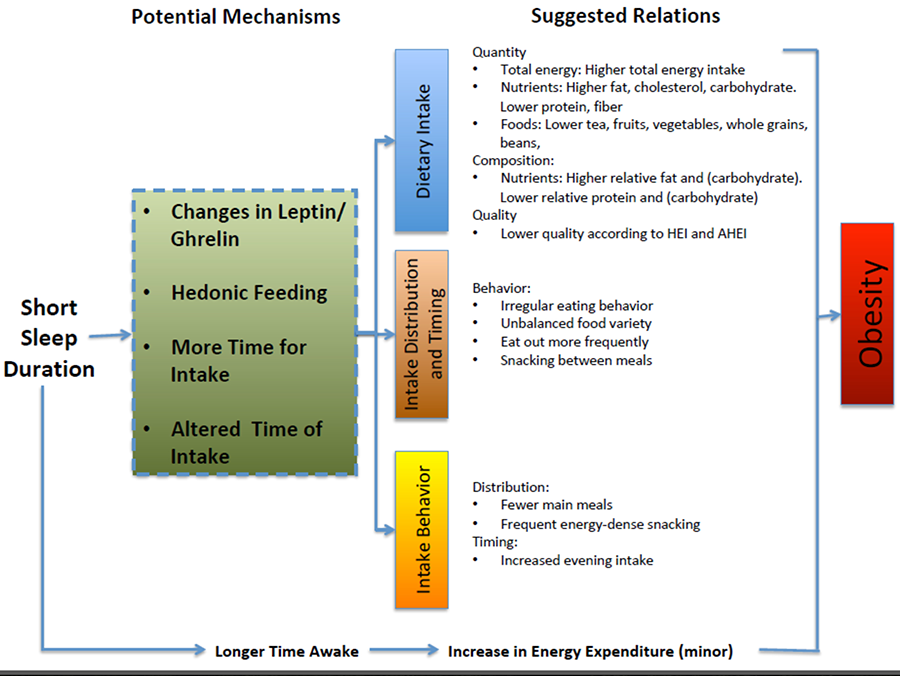
Figure 1. Schematic diagram of the potential dietary and nondietary pathways leading from short sleep duration to obesity. AHEI, Alternative Healthy Eating Index; HEI, Healthy Eating Index.
CLOCK Gene Variation, Type 2 Diabetes and Cardiovascular Diseases
Circadian rhythms regulate key biological processes influencing metabolic pathways. Abnormalities or impairments in these processes are associated with multiple age-related diseases, including type 2 diabetes (T2D) and cardiovascular diseases (CVD). The body’s circadian rhythms are generated by a feedback process involving core clock genes, and one of those core genes, known as CLOCK has been associated in cross-sectional human studies with obesity, hypertension, and T2D prevalence. Our recent work has analyzed the association between a CLOCK gene variant and incidence of T2D and CVD in the 7,098 participants of the PREDIMED trial over 5 years.
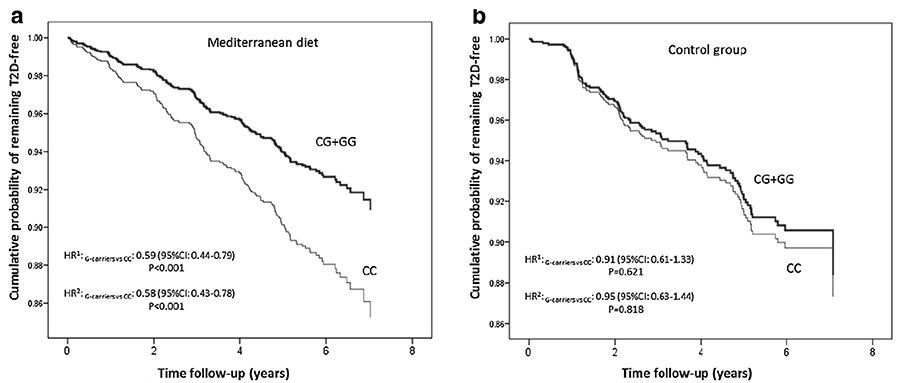
Our analysis demonstrates a significant association between this CLOCK gene variant and T2D incidence in 3,671 of the participants who were T2D-free at the beginning of the study. Namely, those who were carriers of the variant allele showed decreased incidence of T2D during the period of the study. Moreover, we detected a statistically significant interaction between the CLOCK gene variant and T2D status on stroke incidence. This is the first time an association between a CLOCK polymorphism and stroke in T2D subjects has been reported, suggesting that core clock genes may significantly contribute to increased CVD risk in T2D. Our laboratory is investigating further associations with other genes involved in our biological clock.
Figure 2. Cumulative T2D free survival by CLOCK rs4580704 genotypes in non T2D subjects at baseline depending on the dietary intervention group. (a) Mediterranean diet groups (n = 2477); and (b) control group (n = 1194). Cox regression models with outcome of T2D incidence by the CLOCK rs4580704 SNP (CC versus carriers of the G‐allele) were multivariable adjusted for each stratum and the corresponding hazard ratios (HR) and 95 % CI were obtained in the multivariable adjusted models. CC subjects were considered the reference category and HR for G carriers versus CC were estimated. HR1 model adjusted for sex, age and field center. HR2 Models additionally adjusted for BMI, drinking, smoking, physical activity, medications and total energy intake at baseline. P for interaction between the CLOCK SNP (as dominant) with dietary intervention (MedDiet vs control group) = 0.052 in model 2.
Genomics Meets Epigenomics and Nutrition
Epigenomics represents a major bridge between our genome and the exogenous factors that surround the individual, including diet. One of the most studied epigenetic marks is DNA methylation. DNA methylation is influenced by diet and single nucleotide polymorphisms (SNPs), and methylation modulates gene expression. Our objective is to explore whether the gene-by-diet interactions that shape our inflammation status and thus our aging process, act through DNA methylation.
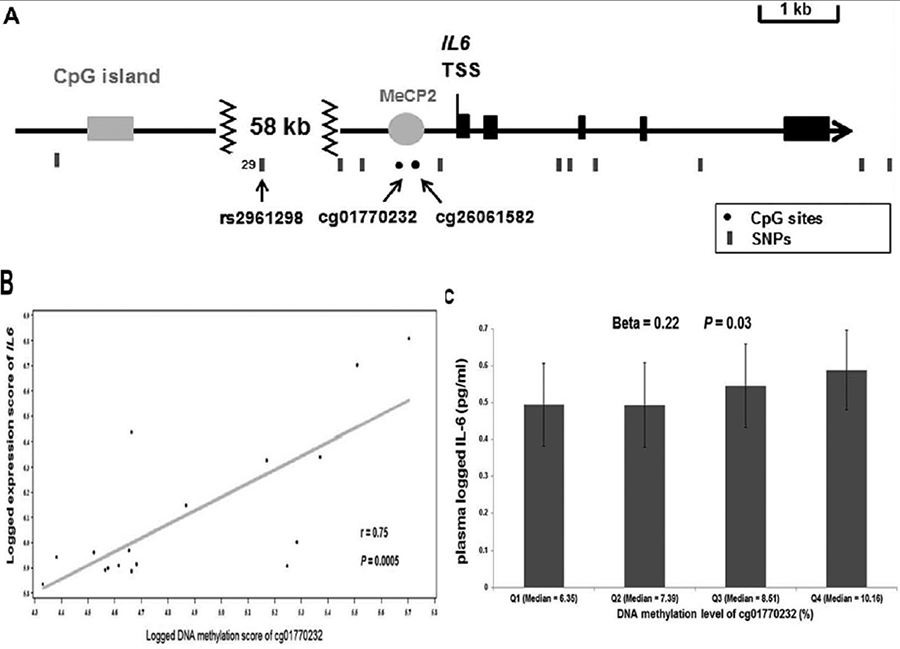
One example of such work is illustrated by the interaction between Omega-3 PUFAs (n-3 PUFAs), Interleukin-6 (IL-6), genetic variants and methylation. N-3 PUFAS reduce IL6 gene expression, but their effects on transcription regulatory mechanisms are unknown. We conducted an integrated analysis using both population and in vitro studies to systematically explore the relationships among n-3 PUFA, DNA methylation, single nucleotide polymorphisms (SNPs), gene expression, and protein concentration of IL6. Using data in the Genetics of Lipid Lowering Drugs and Diet Network (GOLDN) study and the Encyclopedia of DNA Elements (ENCODE) consortium, we found that higher methylation of IL6 promoter cg01770232 was associated with higher IL- 6 plasma concentration (p = 0.03) and greater IL6 gene expression (p = 0.0005). Higher circulating total n-3 PUFA was associated with lower cg01770232 methylation (p = 0.007) and lower IL-6 concentration (p = 0.02). Moreover, an allele of IL6 rs2961298 was associated with higher cg01770232 methylation (p = 2.55 x 10⁻⁷). The association between n-3 PUFA and cg01770232 methylation was dependent on rs2961298 genotype (p = 0.02), but higher total n-3 PUFA was associated with lower cg01770232 methylation in the heterozygotes (p = 0.04) not in the homozygotes.
Therefore, higher n-3 PUFA is associated with lower methylation at IL6 promoter, which may be modified by IL6 SNPs. This work underscores the importance of integrating genetic, epigenetic and dietary information to achieve a better understanding of the cross talk between dietary and metabolic factors, laying the groundwork for future diagnostic and/or therapeutic applications.
Figure 3. Methylation of CpG site cg01770232 within IL6 promoter is associated with both plasma IL-6 concentration and IL6 gene expression. (A) The genomic structure of IL6 locus, in which exons, CpG island, potential binding site for MeCP2, CpG sites, and SNPs are represented by black box, gray box, gray circle, black dots, and black bars, respectively. (B) The Pearson correlation between methylation level of cg01770232 and IL6 gene expression across 17 human cell types in ENCODE, in which each black dot represents one cell type and the gray line represents the corresponding regression line, and the correlation coefficient (r) and its corresponding p-value are shown at the bottom right corner. (C) The association of quartiles of methylation level of cg01770232 with plasma-logged IL-6 concentration (geometric means °æ 95% CI) in GOLDN. p-Value is obtained from the generalized linear model adjusting for first four principal components for cellular purity and population structure, age, sex, center, pedigree, smoking, alcohol intake, total energy intake, physical activity, intake of vitamin B-12 and folate, acute inflammatory conditions (infection or fever), chronic diseases (abdominal obesity, CVD, diabetes, and hypertension), other inflammatory markers (MCP-1, adiponectin, high-sensitivity C-reactive protein, tumor necrosis factor alpha, and IL-2-soluble receptor alpha). TSS, transcription start site; UTR, untranslated region.


